Monitoring#
Overview#
Propeller tracks OS-level metrics for every WebAssembly task running on proplets. The system collects CPU usage, memory consumption, disk I/O, thread counts, and more with minimal performance overhead.
Propeller tracks OS-level metrics for every WebAssembly task running on proplets. The system collects CPU usage, memory consumption, disk I/O, thread counts, and more with minimal performance overhead. The Rust proplet includes built-in monitoring using the sysinfo crate for cross-platform metrics. This provides compatibility across Linux, macOS, and Windows environments.
Architecture#
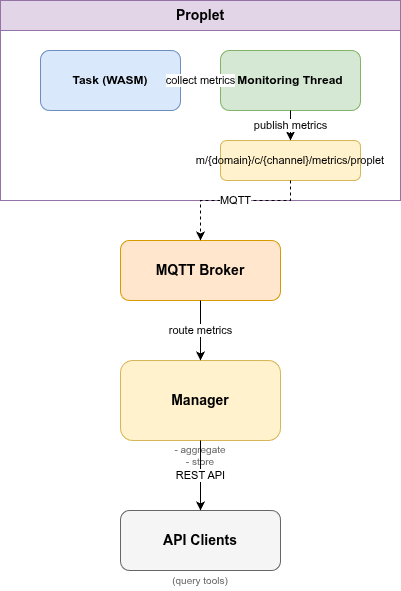
Each proplet monitors its running tasks independently and reports metrics to the manager via MQTT. The manager aggregates metrics from all proplets, stores historical data, and exposes REST API endpoints for querying.
Data Flow#
- Proplet spawns a monitoring thread for each task
- Thread collects process metrics at configured intervals (1-120 seconds)
- Metrics are published to MQTT topics:
- Proplet-level:
m/{domain}/c/{channel}/control/proplet/metrics - Task-level:
m/{domain}/c/{channel}/control/proplet/task_metrics - Manager receives and stores metrics in memory
- API clients query metrics via HTTP endpoints
Component Responsibilities#
- Proplet: Collects task-level process metrics using system APIs
- Manager: Aggregates, stores, and serves metrics via REST API
- MQTT Broker: Routes metrics between proplets and manager
Metrics#
The system tracks the following process-level metrics:
| Metric | Description | Unit |
|---|---|---|
| CPU Usage | Process CPU time as percentage of one core | Percent (0-100+) |
| Memory Usage | Process memory consumption | Bytes |
| Memory Percent | Process memory as percentage of total RAM | Percent (0-100) |
| Disk Read | Cumulative bytes read from disk | Bytes |
| Disk Write | Cumulative bytes written to disk | Bytes |
| Uptime | Process runtime since start | Seconds |
| Thread Count | Number of OS threads | Integer |
| File Descriptors | Open file handles (Linux/macOS) | Integer |
Each metric sample includes an ISO 8601 timestamp for time-series analysis.
Monitoring Profiles#
Profiles define which metrics to collect, how often, and how much history to retain.
Standard#
Balanced monitoring for typical tasks.
{
  "enabled": true,
  "interval": 10,
  "collect_cpu": true,
  "collect_memory": true,
  "collect_disk_io": true,
  "collect_threads": true,
  "collect_file_descriptors": true,
  "export_to_mqtt": true,
  "retain_history": true,
  "history_size": 100
}
- Interval: 10 seconds
- Metrics: All available
- History: 100 samples (~16 minutes)
- Best for: Short to medium tasks, general workloads
Minimal#
Lightweight monitoring for resource-constrained devices.
{
  "enabled": true,
  "interval": 60,
  "collect_cpu": true,
  "collect_memory": true,
  "collect_disk_io": false,
  "collect_threads": false,
  "collect_file_descriptors": false,
  "export_to_mqtt": false,
  "retain_history": false,
  "history_size": 0
}
- Interval: 60 seconds
- Metrics: CPU and memory only
- History: None
- Best for: IoT devices, edge nodes, battery-powered systems
Intensive#
High-frequency monitoring for debugging and profiling.
{
  "enabled": true,
  "interval": 1,
  "collect_cpu": true,
  "collect_memory": true,
  "collect_disk_io": true,
  "collect_threads": true,
  "collect_file_descriptors": true,
  "export_to_mqtt": true,
  "retain_history": true,
  "history_size": 1000
}
- Interval: 1 second
- Metrics: All available
- History: 1000 samples (~16 minutes)
- Best for: Performance troubleshooting, memory leak detection, development
Batch processing#
Optimized for long-running data processing tasks.
{
  "enabled": true,
  "interval": 30,
  "collect_cpu": true,
  "collect_memory": true,
  "collect_disk_io": true,
  "collect_threads": false,
  "collect_file_descriptors": false,
  "export_to_mqtt": true,
  "retain_history": true,
  "history_size": 200
}
- Interval: 30 seconds
- Metrics: CPU, memory, disk I/O
- History: 200 samples (~100 minutes)
- Best for: ETL pipelines, batch jobs, data transformations
Long-running daemon#
Low-frequency monitoring for background services.
{
  "enabled": true,
  "interval": 120,
  "collect_cpu": true,
  "collect_memory": true,
  "collect_disk_io": true,
  "collect_threads": true,
  "collect_file_descriptors": true,
  "export_to_mqtt": true,
  "retain_history": true,
  "history_size": 500
}
- Interval: 120 seconds
- Metrics: All available
- History: 500 samples (~16 hours)
- Best for: Background daemons, always-on services, message processors
Automatic selection#
If no profile is specified, Propeller automatically selects an appropriate profile:
- Non-daemon tasks: Standard profile (10s intervals)
- Daemon tasks: Long-running daemon profile (120s intervals)
Configuration#
Global Settings#
Control monitoring behavior using environment variables.
Proplet environment variables:
export PROPLET_ENABLE_MONITORING=true # Enable/disable monitoring (default: true)
This setting applies to all tasks unless overridden by per-task configuration.
Per-Task Configuration#
Specify a monitoring profile in your task payload to override global settings.
Example task with custom monitoring:
{
  "id": "550e8400-e29b-41d4-a716-446655440001",
  "name": "compute",
  "image_url": "docker.io/myorg/compute:v1",
  "inputs": [10, 20],
  "daemon": false,
  "monitoring_profile": {
    "enabled": true,
    "interval": 5,
    "collect_cpu": true,
    "collect_memory": true,
    "collect_disk_io": true,
    "collect_threads": true,
    "collect_file_descriptors": true,
    "export_to_mqtt": true,
    "retain_history": true,
    "history_size": 200
  }
}
If no profile is specified, Propeller uses automatic selection based on the task type.
Examples#
Standard Monitoring#
curl -X POST "http://localhost:7070/tasks" \
-H "Content-Type: application/json" \
-d '{
  "name": "compute",
  "image_url": "docker.io/myorg/compute:v1",
  "inputs": [10, 20],
  "daemon": false
}'
The task uses the standard profile with 10-second metric intervals.
High-Frequency Debugging#
curl -X POST "http://localhost:7070/tasks" \
-H "Content-Type: application/json" \
-d '{
  "name": "debug_task",
  "image_url": "docker.io/myorg/app:debug",
  "inputs": [],
  "monitoring_profile": {
    "enabled": true,
    "interval": 1,
    "collect_cpu": true,
    "collect_memory": true,
    "collect_disk_io": true,
    "collect_threads": true,
    "collect_file_descriptors": true,
    "export_to_mqtt": true,
    "retain_history": true,
    "history_size": 1000
  }
}'
Metrics are collected every second with 1000-sample history retention.
Minimal Overhead#
curl -X POST "http://localhost:7070/tasks" \
-H "Content-Type: application/json" \
-d '{
  "name": "lightweight_task",
  "image_url": "docker.io/myorg/light:v1",
  "monitoring_profile": {
    "enabled": true,
    "interval": 60,
    "collect_cpu": true,
    "collect_memory": true,
    "collect_disk_io": false,
    "collect_threads": false,
    "collect_file_descriptors": false,
    "export_to_mqtt": false,
    "retain_history": false,
    "history_size": 0
  }
}'
Only CPU and memory are collected every 60 seconds with no MQTT export.
Batch Processing#
curl -X POST "http://localhost:7070/tasks" \
-H "Content-Type: application/json" \
-d '{
  "name": "process_batch",
  "image_url": "docker.io/myorg/batch:v1",
  "inputs": [1000],
  "env": {
    "BATCH_SIZE": "1000",
    "WORKERS": "4"
  },
  "monitoring_profile": {
    "enabled": true,
    "interval": 30,
    "collect_cpu": true,
    "collect_memory": true,
    "collect_disk_io": true,
    "collect_threads": false,
    "collect_file_descriptors": false,
    "export_to_mqtt": true,
    "retain_history": true,
    "history_size": 200
  }
}'
Metrics focus on CPU, memory, and disk I/O with 30-second intervals.
Metrics Export#
MQTT Topics#
Topic pattern:
m/{domain_id}/c/{channel_id}/metrics/proplet
All proplets publish to this topic regardless of implementation (Go or Rust).
Message Format#
{
  "task_id": "550e8400-e29b-41d4-a716-446655440001",
  "proplet_id": "7c9e6679-7425-40de-944b-e07fc1f90ae7",
  "metrics": {
    "cpu_percent": 23.5,
    "memory_bytes": 52428800,
    "memory_percent": 1.2,
    "disk_read_bytes": 1048576,
    "disk_write_bytes": 524288,
    "uptime_seconds": 45,
    "thread_count": 2,
    "file_descriptor_count": 8
  },
  "aggregated": {
    "avg_cpu_usage": 38.2,
    "max_cpu_usage": 65.0,
    "avg_memory_usage": 62914560,
    "max_memory_usage": 71303168,
    "total_disk_read": 2097152,
    "total_disk_write": 1048576,
    "sample_count": 24
  },
  "timestamp": "2025-01-15T10:35:22.123456Z"
}
The aggregated field is only present when retain_history: true in the monitoring profile.
Subscribing to Metrics#
Subscribe to specific domain/channel:
mosquitto_sub -h localhost -p 1883 \
  -t "m/domain-123/c/channel-456/metrics/proplet" -v
Subscribe to all metrics:
mosquitto_sub -h localhost -p 1883 \
  -t "m/+/c/+/metrics/#" -v
API Endpoints#
Get task metrics:
curl "http://localhost:7070/tasks/{task_id}/metrics?offset=0&limit=100"
Get proplet metrics:
curl "http://localhost:7070/proplets/{proplet_id}/metrics?offset=0&limit=100"
Response includes paginated metrics with aggregated statistics.
Platform Support#
Linux#
| Metric | Method |
|---|---|
| CPU | /proc/[pid]/stat |
| Memory | /proc/[pid]/status |
| Disk I/O | /proc/[pid]/io |
| Threads | /proc/[pid]/task |
| File descriptors | /proc/[pid]/fd |
All metrics are available with high accuracy.
macOS#
Full metric support using system APIs.
| Metric | Method |
|---|---|
| CPU | System calls |
| Memory | System APIs |
| Disk I/O | System counters |
| Threads | System APIs |
| File descriptors | lsof or system calls |
Performance is comparable to Linux with all metrics available.
Windows#
Limited metric support due to platform constraints.
| Metric | Support |
|---|---|
| CPU | Full |
| Memory | Full |
| Disk I/O | Full |
| Threads | Limited (may report 1) |
| File descriptors | Not supported (always 0) |
Consider running on Linux/macOS for full observability.
Integration with External Systems#
Prometheus#
Install mqtt2prometheus:
docker run -d \
  --name mqtt2prometheus \
  -p 9641:9641 \
  hikhvar/mqtt2prometheus:latest
Configure Prometheus scraping:
scrape_configs:
  - job_name: "propeller"
    static_configs:
      - targets: ["mqtt2prometheus:9641"]
Metrics become queryable in PromQL for alerting and dashboards.
Grafana#
Build dashboards using Prometheus or MQTT datasource.
Recommended panels:
- CPU usage timeline (line chart)
- Memory consumption (area chart)
- Disk I/O throughput (stacked area)
- Thread count (gauge)
- Per-task comparison (bar chart)
Import metrics from Prometheus or connect directly to MQTT broker.
Performance Overhead#
| Profile | CPU Overhead | Memory Overhead |
|---|---|---|
| Minimal | < 0.1% | ~1 MB |
| Standard | < 0.5% | ~2 MB |
| Intensive | < 2% | ~5 MB |
Memory usage scales linearly with history retention:
- No history: ~1 MB
- 100 samples: ~2 MB
- 1000 samples: ~5 MB
CPU overhead primarily comes from system call frequency.
Troubleshooting#
No Metrics Published#
Check global monitoring setting:
echo $PROPLET_ENABLE_MONITORING
Verify MQTT connectivity:
mosquitto_sub -h localhost -p 1883 -t "m/+/c/+/metrics/#" -v
Ensure task has monitoring enabled:
{
  "monitoring_profile": {
    "enabled": true,
    "export_to_mqtt": true
  }
}
Review proplet logs:
docker logs propeller-proplet
High CPU Overhead#
Reduce collection frequency and disable unused metrics.
{
  "monitoring_profile": {
    "interval": 60,
    "collect_disk_io": false,
    "collect_threads": false,
    "retain_history": false
  }
}
High Memory Usage#
Disable history retention or reduce sample count.
{
  "monitoring_profile": {
    "retain_history": false,
    "history_size": 0
  }
}
Missing Metrics on Windows#
Windows has limited support for threads and file descriptors. Use Linux or macOS for full metric availability.
Inaccurate CPU Measurements#
CPU percentage is calculated over the collection interval. Use intervals ≥ 1 second for stable readings. CPU-bound processes show more accurate metrics than I/O-bound processes.
API Reference#
Monitoring Profile Schema#
{
  "enabled": true,
  "interval": 10,
  "collect_cpu": true,
  "collect_memory": true,
  "collect_disk_io": true,
  "collect_threads": true,
  "collect_file_descriptors": true,
  "export_to_mqtt": true,
  "retain_history": true,
  "history_size": 100
}
| Field | Type | Description |
|---|---|---|
enabled |
boolean | Enable/disable monitoring |
interval |
integer | Collection interval (seconds) |
collect_cpu |
boolean | Track CPU usage |
collect_memory |
boolean | Track memory usage |
collect_disk_io |
boolean | Track disk I/O |
collect_threads |
boolean | Track thread count |
collect_file_descriptors |
boolean | Track file descriptors |
export_to_mqtt |
boolean | Publish to MQTT |
retain_history |
boolean | Keep historical samples |
history_size |
integer | Number of samples to retain |
Metrics Schema#
{
  "cpu_percent": 23.5,
  "memory_bytes": 52428800,
  "memory_percent": 1.2,
  "disk_read_bytes": 1048576,
  "disk_write_bytes": 524288,
  "uptime_seconds": 45,
  "thread_count": 2,
  "file_descriptor_count": 8
}
| Field | Type | Description |
|---|---|---|
cpu_percent |
float | CPU usage (0-100+ per core) |
memory_bytes |
integer | Memory usage in bytes |
memory_percent |
float | Memory as % of total RAM |
disk_read_bytes |
integer | Cumulative bytes read |
disk_write_bytes |
integer | Cumulative bytes written |
uptime_seconds |
integer | Process runtime |
thread_count |
integer | OS thread count |
file_descriptor_count |
integer | Open file handles |
Aggregated Metrics Schema#
{
  "avg_cpu_usage": 38.2,
  "max_cpu_usage": 65.0,
  "avg_memory_usage": 62914560,
  "max_memory_usage": 71303168,
  "total_disk_read": 2097152,
  "total_disk_write": 1048576,
  "sample_count": 24
}
| Field | Type | Description |
|---|---|---|
avg_cpu_usage |
float | Average CPU over history |
max_cpu_usage |
float | Peak CPU over history |
avg_memory_usage |
integer | Average memory (bytes) |
max_memory_usage |
integer | Peak memory (bytes) |
total_disk_read |
integer | Total bytes read |
total_disk_write |
integer | Total bytes written |
sample_count |
integer | Number of samples |
Getting Started#
Start Infrastructure#
cd propeller
make start-supermq
Enable Monitoring#
export PROPLET_ENABLE_MONITORING=true
docker restart propeller-proplet
Subscribe to Metrics#
mosquitto_sub -h localhost -p 1883 -t "m/+/c/+/metrics/#" -v
Create Task#
curl -X POST "http://localhost:7070/tasks" \
-H "Content-Type: application/json" \
-d '{
  "name": "compute",
  "image_url": "docker.io/myorg/compute:v1",
  "inputs": [10, 20]
}'
Start the task:
curl -X POST "http://localhost:7070/tasks/{task_id}/start"
Metrics will appear in the MQTT subscriber terminal every 10 seconds.